qp.drawer.MPLDrawer
- class MPLDrawer(n_layers, wire_map, c_wires=0, *, wire_options=None, figsize=None, fig=None, starting_dots=False)[source]
Bases:
objectAllows easy creation of graphics representing circuits with matplotlib
- Parameters:
n_layers (int) – the number of layers
wire_map (dict) – the wires to be drawn. A dict mapping wire label to index (from top to bottom) in the figure
- Keyword Arguments:
c_wires=0 (int) – the number of classical wires to leave space for.
wire_options=None (dict) – matplotlib configuration options for drawing the wire lines
figsize=None (Iterable) – Allows users to specify the size of the figure manually. Defaults to scale with the size of the circuit via
n_layersandlen(wire_map).fig=None (matplotlib Figure) – Allows users to specify the figure window to plot to.
starting_dots=False (bool) – Adds dots after the wire labels. Can be used to denote this plot follows after another one.
Example
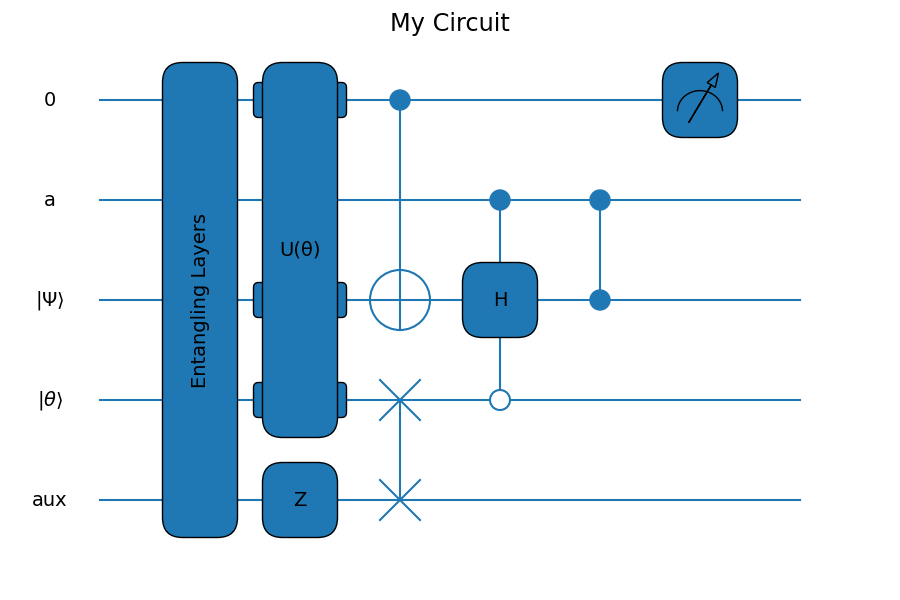
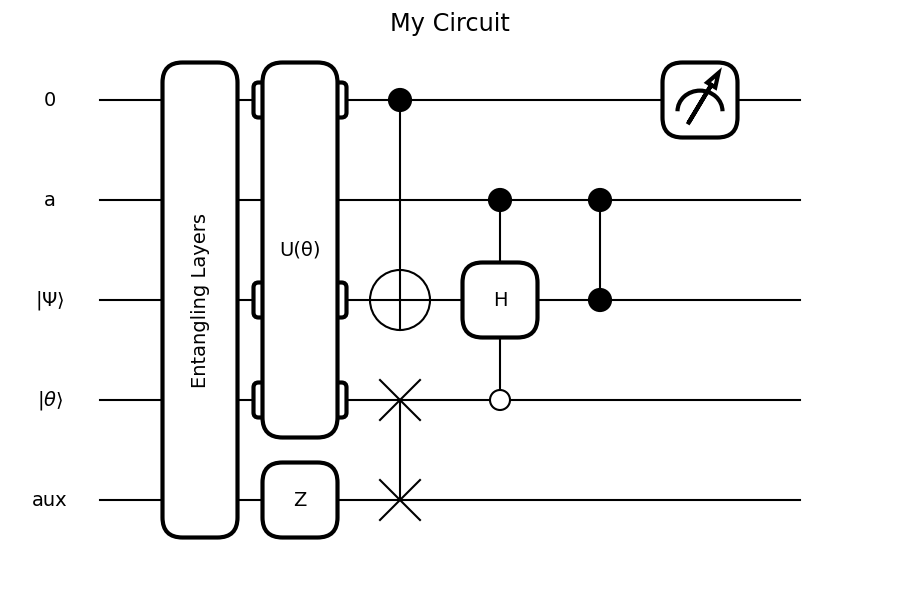
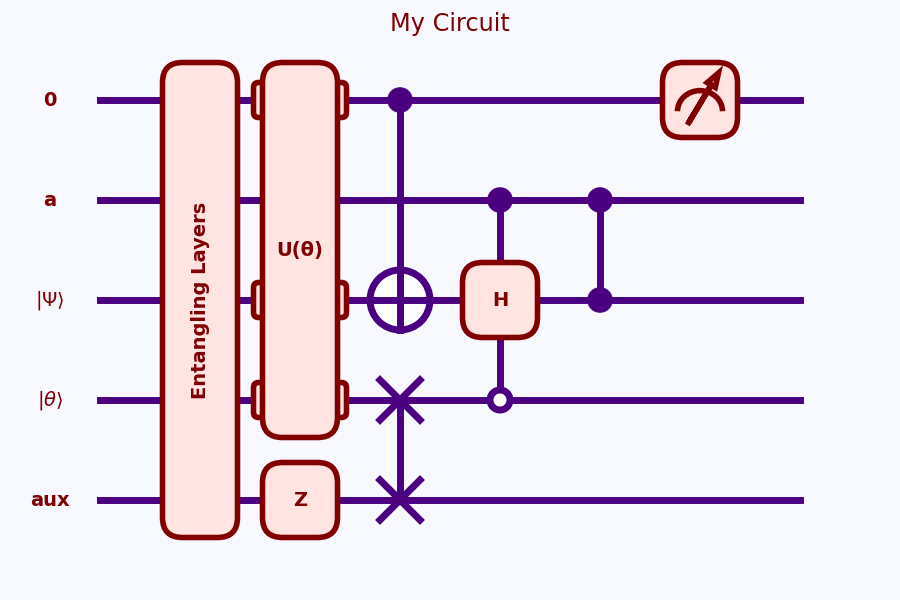
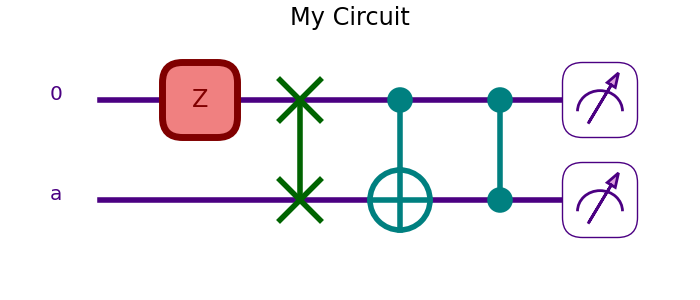
drawer = qp.drawer.MPLDrawer(wire_map={i: i for i in range(5)}, n_layers=6)

drawer.label(["0", "a", r"$|\Psi\rangle$", r"$|\theta\rangle$", "aux"])

drawer.box_gate(layer=0, wires=[0, 1, 2, 3, 4], text="Entangling Layers")
drawer.box_gate(layer=1, wires=[0, 2, 3], text="U(θ)")

drawer.box_gate(layer=1, wires=4, text="Z")

drawer.SWAP(layer=2, wires=(3,4))
drawer.CNOT(layer=2, wires=(0, 2))

drawer.ctrl(layer=3, wires=[1, 3], control_values=[True, False])
drawer.box_gate(
    layer=3, wires=2, text="H", box_options={"zorder": 4}, text_options={"zorder": 5}
)

drawer.ctrl(layer=4, wires=[1, 2])

drawer.measure(layer=5, wires=0)

drawer.fig.suptitle('My Circuit', fontsize='xx-large')
Usage Details
Matplotlib Integration
This class relies on matplotlib. As such, users can extend this class via interacting with the figure
drawer.figand axesdrawer.axobjects manually. For instance, the example circuit manipulates the figure to set a title usingdrawer.fig.suptitle. Users can save the image usingplt.savefigor via the figure methoddrawer.fig.savefig.As described in the next section, the figure supports both global styling and individual styling of elements with matplotlib styles, configuration, and keywords.
Formatting
PennyLane has inbuilt styles for controlling the appearance of the circuit drawings. All available styles can be determined by evaluating
qp.drawer.available_styles(). Any available string can then be passed toqp.drawer.use_style.qp.drawer.use_style('black_white')
You can also control the appearance with matplotlib’s provided tools, see the matplotlib docs . For example, we can customize
plt.rcParams:plt.rcParams['patch.facecolor'] = 'mistyrose' plt.rcParams['patch.edgecolor'] = 'maroon' plt.rcParams['text.color'] = 'maroon' plt.rcParams['font.weight'] = 'bold' plt.rcParams['patch.linewidth'] = 4 plt.rcParams['patch.force_edgecolor'] = True plt.rcParams['lines.color'] = 'indigo' plt.rcParams['lines.linewidth'] = 5 plt.rcParams['figure.facecolor'] = 'ghostwhite'
You can also manually control the styles of individual plot elements via the drawer class. All accept dictionaries of keyword-values pairs for matplotlib object components. Acceptable keywords differ based on what’s being drawn. For example, you cannot pass
"fontsize"to the dictionary controlling how to format a rectangle. For the control-type gatesCNOTandctrlthe options dictionary can only contain'linewidth','color', or'zorder'keys.This example demonstrates the different ways you can format the individual elements:
wire_options = {"color": "indigo", "linewidth": 4}
drawer = MPLDrawer(wire_map={0: 0, 1: 1}, n_layers=4, wire_options=wire_options)

label_options = {"fontsize": "x-large", 'color': 'indigo'}
drawer.label(["0", "a"], text_options=label_options)

box_options = {'facecolor': 'lightcoral', 'edgecolor': 'maroon', 'linewidth': 5}
text_options = {'fontsize': 'xx-large', 'color': 'maroon'}
drawer.box_gate(layer=0, wires=0, text="Z", box_options=box_options, text_options=text_options)

swap_options = {'linewidth': 4, 'color': 'darkgreen'}
drawer.SWAP(layer=1, wires=(0, 1), options=swap_options)

ctrl_options = {'linewidth': 4, 'color': 'teal'}
drawer.CNOT(layer=2, wires=(0, 1), options=ctrl_options)
drawer.ctrl(layer=3, wires=(0, 1), options=ctrl_options)


measure_box = {'facecolor': 'white', 'edgecolor': 'indigo'}
measure_lines = {'edgecolor': 'indigo', 'facecolor': 'plum', 'linewidth': 2}
for wire in range(2):
    drawer.measure(layer=4, wires=wire, box_options=measure_box, lines_options=measure_lines)

drawer.fig.suptitle('My Circuit', fontsize='xx-large')
Positioning
Each gate takes arguments in order of
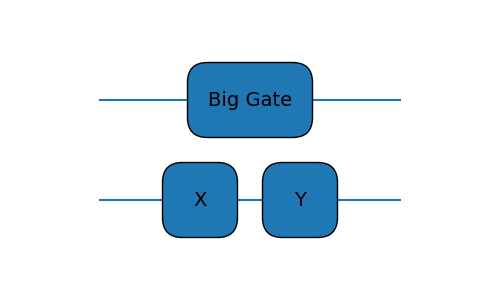
layerfollowed bywires. These translate toxandycoordinates in the graph. Layer number (x) increases as you go right, and wire number (y) increases as you go down; the y-axis is inverted. You can pass non-integer values to either keyword. If you have a long label, the gate can span multiple layers and have extra width:drawer = MPLDrawer(2, {0:0, 1:1}) drawer.box_gate(layer=0, wires=1, text="X") drawer.box_gate(layer=1, wires=1, text="Y") # Gate between two layers drawer.box_gate(layer=0.5, wires=0, text="Big Gate", extra_width=0.5)
Attributes
Matplotlib axes
Matplotlib figure
Default fontsize for text.
Gets the x-offset for drawing the control wire of a PauliMeasure.
- ax
Matplotlib axes
- fig
Matplotlib figure
- fontsize
Default fontsize for text. Defaults to 14.
- ppm_offset
Gets the x-offset for drawing the control wire of a PauliMeasure.
Methods
CNOT(layer, wires[, control_values, options])Draws a CNOT gate.
SWAP(layer, wires[, options])Draws a SWAP gate
box_gate(layer, wires[, text, box_options, ...])Draws a box and adds label text to its center.
classical_wire(layers, wires)Draw a classical control line.
cond(layer, measured_layer, wires, wires_target)Add classical communication double-lines for conditional operations
Crop away the wire labels and resize figure accordingly.
ctrl(layer, wires[, wires_target, ...])Add an arbitrary number of control wires
cwire_join(layer, wire[, erase_right])Erase the horizontal edges of an intersection between classical wires.
erase_wire(layer, wire, length)Erases a portion of a wire by adding a rectangle that matches the background.
label(labels[, text_options])Label each wire.
measure(layer, wires[, text, box_options, ...])Draw a Measurement graphic at designated layer, wire combination.
pauli_measure(layer, pauli_word, wires[, ...])Draw a PauliMeasure at the designated layer.
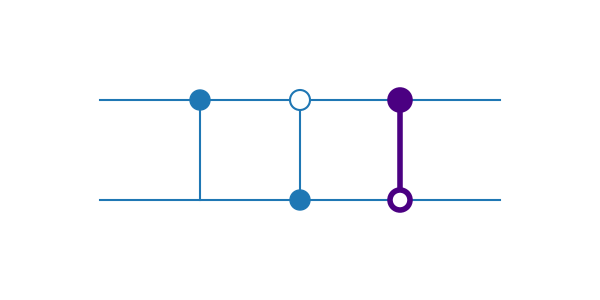
- CNOT(layer, wires, control_values=None, options=None)[source]
Draws a CNOT gate.
- Parameters:
layer (int) – layer to draw in
control_values=None (Union[bool, Iterable[bool]]) – for each control wire, denotes whether to control on
False=0orTrue=1wires (Union[int, Iterable[int]]) – wires to use. Last wire is the target.
- Keyword Arguments:
options=None – Matplotlib options. The only supported keys are
'color','linewidth', and'zorder'.
Example
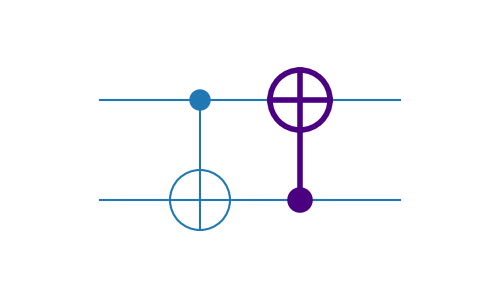
drawer = MPLDrawer(wire_map={0:0, 1:1}, n_layers=2)

drawer.CNOT(0, (0, 1))

options = {'color': 'indigo', 'linewidth': 4}
drawer.CNOT(1, (1, 0), options=options)
- SWAP(layer, wires, options=None)[source]
Draws a SWAP gate
- Parameters:
layer (int) – layer to draw on
wires (Tuple[int, int]) – two wires the SWAP acts on
- Keyword Arguments:
options=None (dict) – matplotlib keywords for
Line2Dobjects
Example
The
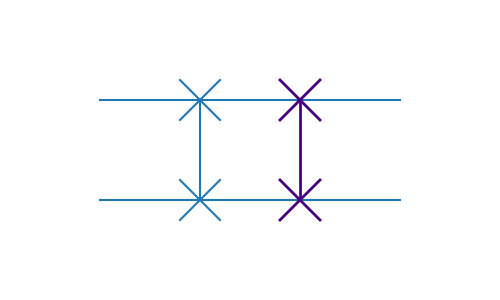
optionskeyword can accept any Line2D compatible keywords in a dictionary.drawer = MPLDrawer(wire_map={0:0, 1:1}, n_layers=2) drawer.SWAP(0, (0, 1)) swap_options = {"linewidth": 2, "color": "indigo"} drawer.SWAP(1, (0, 1), options=swap_options)
- box_gate(layer, wires, text='', box_options=None, text_options=None, **kwargs)[source]
Draws a box and adds label text to its center.
- Parameters:
layer (int) – x coordinate for the box center
wires (Union[int, Iterable[int]]) – y locations to include inside the box. Only min and max of an Iterable affect the output
text (str) – string to print at the box’s center
- Keyword Arguments:
box_options=None (dict) – any matplotlib keywords for the
plt.Rectanglepatchtext_options=None (dict) – any matplotlib keywords for the text
extra_width (float) – extra box width
autosize (bool) – whether to rotate and shrink text to fit within the box
active_wire_notches (bool) – whether or not to add notches indicating active wires. Defaults to
True.
Example
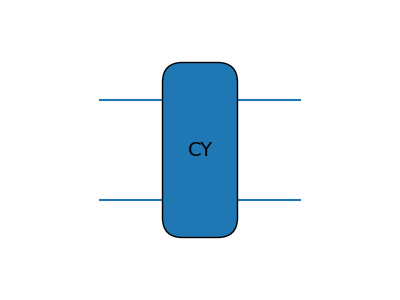
drawer = MPLDrawer(wire_map={0:0, 1:1}, n_layers=1)

drawer.box_gate(layer=0, wires=(0, 1), text="CY")
Usage Details
This method can accept two different sets of design keywords.
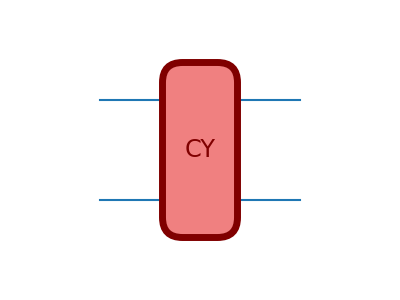
box_optionstakes Rectangle keywords , andtext_optionsaccepts Matplotlib Text keywords .box_options = {'facecolor': 'lightcoral', 'edgecolor': 'maroon', 'linewidth': 5} text_options = {'fontsize': 'xx-large', 'color': 'maroon'} drawer = MPLDrawer(wire_map={0:0, 1:1}, n_layers=1) drawer.box_gate(layer=0, wires=(0, 1), text="CY", box_options=box_options, text_options=text_options)
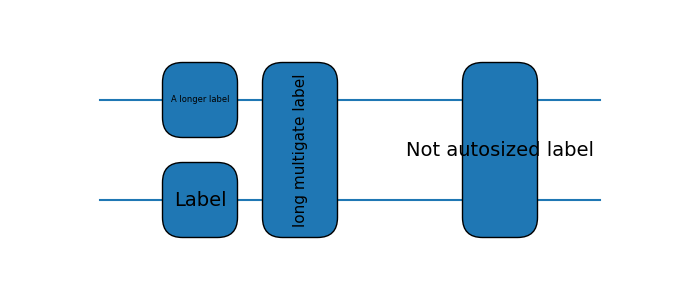
By default, text is rotated and/or shrunk to fit within the box. This behaviour can be turned off with the
autosize=Falsekeyword.drawer = MPLDrawer(n_layers=4, wire_map={0:0, 1:1}) drawer.box_gate(layer=0, wires=0, text="A longer label") drawer.box_gate(layer=0, wires=1, text="Label") drawer.box_gate(layer=1, wires=(0,1), text="long multigate label") drawer.box_gate(layer=3, wires=(0,1), text="Not autosized label", autosize=False)
- classical_wire(layers, wires)[source]
Draw a classical control line.
- Parameters:
layers – a list of x coordinates for the classical wire
wires – a list of y coordinates for the classical wire. Wire numbers greater than the number of quantum wires will be scaled as classical wires.
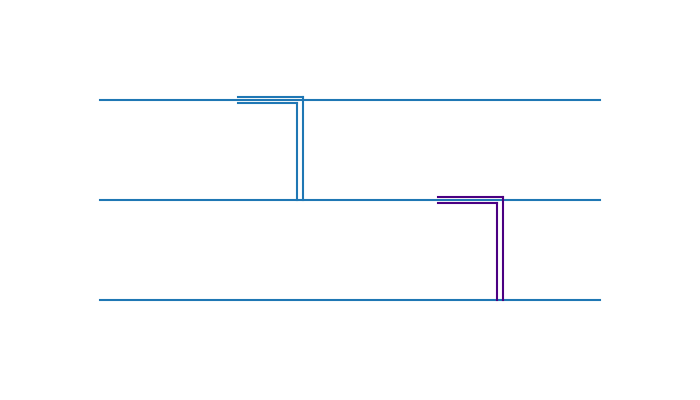
- cond(layer, measured_layer, wires, wires_target, options=None)[source]
Add classical communication double-lines for conditional operations
- Parameters:
layer (int) – the layer to draw vertical lines in, containing the target operation
measured_layer (int) – the layer where the mid-circuit measurements are
wires (Union[int, Iterable[int]]) – set of wires to control on
wires_target (Union[int, Iterable[int]]) – target wires. Used to determine where to terminate the vertical double-line
- Keyword Arguments:
options=None (dict) – Matplotlib keywords passed to
plt.Line2D
Example
drawer = MPLDrawer(wire_map={0:0, 1:1, 2:2}, n_layers=4)

drawer.cond(layer=1, measured_layer=0, wires=[0], wires_target=[1])

options = {'color': "indigo", 'linewidth': 1.5}
drawer.cond(layer=3, measured_layer=2, wires=(1,), wires_target=(2,), options=options)
- ctrl(layer, wires, wires_target=None, control_values=None, options=None)[source]
Add an arbitrary number of control wires
- Parameters:
layer (int) – the layer to draw the object in
wires (Union[int, Iterable[int]]) – set of wires to control on
- Keyword Arguments:
wires_target=None (Union[int, Iterable[int]]) – target wires. Used to determine min and max wires for the vertical line
control_values=None (Union[bool, Iterable[bool]]) – for each control wire, denotes whether to control on
False=0orTrue=1options=None (dict) – Matplotlib keywords. The only supported keys are
'color','linewidth', and'zorder'.
Example
drawer = MPLDrawer(wire_map={0:0, 1:1}, n_layers=3)

drawer.ctrl(layer=0, wires=0, wires_target=1)
drawer.ctrl(layer=1, wires=(0, 1), control_values=[0, 1])

options = {'color': "indigo", 'linewidth': 4}
drawer.ctrl(layer=2, wires=(0, 1), control_values=[1, 0], options=options)
- cwire_join(layer, wire, erase_right=False)[source]
Erase the horizontal edges of an intersection between classical wires. By default, erases only the left edge.
- Parameters:
layer – the x-coordinate for the classical wire intersection
wire – the classical wire y-coordinate for the intersection
erase_right=False (bool) – whether or not to erase the right side of the intersection in addition to the left.
- erase_wire(layer, wire, length)[source]
Erases a portion of a wire by adding a rectangle that matches the background.
- Parameters:
layer (int) – starting x coordinate for erasing the wire
wire (int) – y location to erase the wire from
length (float, int) – horizontal distance from
layerto erase the background.
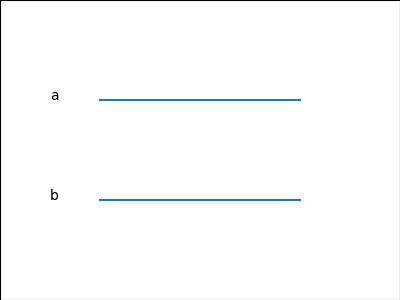
- label(labels, text_options=None)[source]
Label each wire.
- Parameters:
labels (Iterable[str]) – Iterable of labels for the wires
- Keyword Arguments:
text_options (dict) – any matplotlib keywords for a text object, such as font or size
Example
drawer = MPLDrawer(wire_map={0:0, 1:1}, n_layers=1)
drawer.label(["a", "b"])
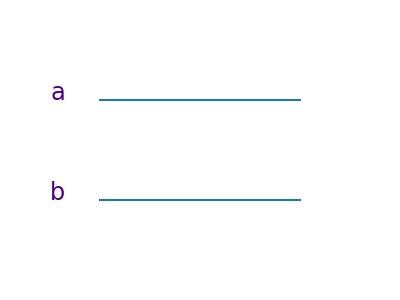
You can also pass any Matplotlib Text keywords as a dictionary to the
text_optionskeyword:drawer = MPLDrawer(wire_map={0:0, 1:1}, n_layers=1) drawer.label(["a", "b"], text_options={"color": "indigo", "fontsize": "xx-large"})
- measure(layer, wires, text=None, box_options=None, lines_options=None)[source]
Draw a Measurement graphic at designated layer, wire combination.
- Parameters:
layer (int) – layer to draw on
wires (int) – wire to draw on
- Keyword Arguments:
text=None (str) – an annotation for the lower right corner.
box_options=None (dict) – dictionary to format a matplotlib rectangle
lines_options=None (dict) – dictionary to format matplotlib arc and arrow
Example
This method accepts two different formatting dictionaries.
box_optionsedits the rectangle whilelines_optionsedits the arc and arrow.drawer = MPLDrawer(wire_map={0:0, 1:1}, n_layers=1) drawer.measure(layer=0, wires=0) measure_box = {'facecolor': 'white', 'edgecolor': 'indigo'} measure_lines = {'edgecolor': 'indigo', 'facecolor': 'plum', 'linewidth': 2} drawer.measure(layer=0, wires=1, box_options=measure_box, lines_options=measure_lines)