qml.drawer
The drawer module contains the code for generating visuals
of circuits.
This module provides the circuit drawing functionality used to display circuits visually.
Functions
|
Create a function that draws the given QNode or quantum function. |
|
Draw a qnode with matplotlib |
|
Produces matplotlib graphic objects ( |
|
Text based diagram for a Quantum Tape. |
Classes
|
Allows easy creation of graphics representing circuits with matplotlib |
Styling Matplotlib Circuit Graphics
The drawer module provides two functions for modifying the style of matplotlib
graphics, such as those generated by qml.draw_mpl. The qml.drawer.use_style
function modifies the plt.rcParams global styling variable. Any styling can
be reset with qml.drawer.use_style('black_white').
Get available style specification strings. |
|
|
Set a style setting. |
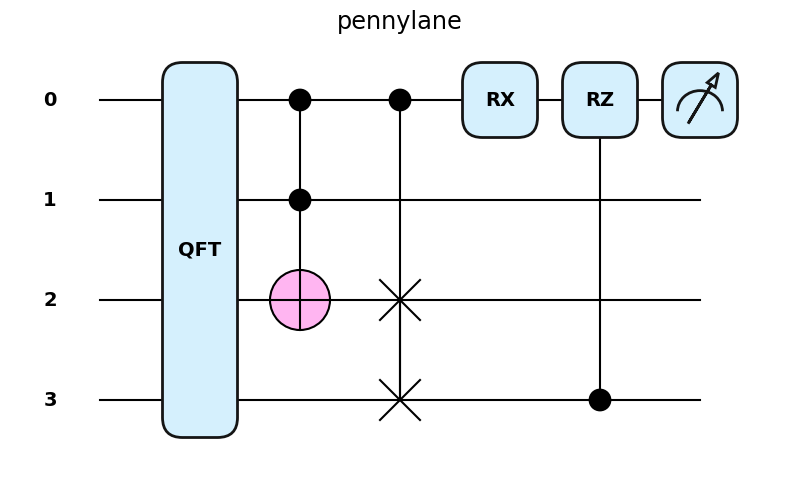
The following images are generated via the following code, where style is
replaced by an available style specification string (e.g., "pennylane" or
"solarized_light"):
@qml.qnode(qml.device('lightning.qubit', wires=(0,1,2,3)))
def circuit(x, z):
    qml.QFT(wires=(0,1,2,3))
    qml.Toffoli(wires=(0,1,2))
    qml.CSWAP(wires=(0,2,3))
    qml.RX(x, wires=0)
    qml.CRZ(z, wires=(3,0))
    return qml.expval(qml.PauliZ(0))

qml.drawer.use_style(style)
fig, ax = qml.draw_mpl(circuit)(1.2345, 1.2345)
Note that the shown pennylane style can be replicated exactly by having the
Quicksand Bold font installed and refreshing the Matplotlib font cache (by
deleting the fontlist file in the Matplotlib cache directory) — to find the
cache directory, run matplotlib.get_cachedir(). If this font is not
available, the drawer will fall back on a default font.


