qp.drawer.draw_mpl
- draw_mpl(qnode, wire_order=None, show_all_wires=False, decimals=None, style=None, *, max_length=None, fig=None, level='gradient', **kwargs)[source]
Draw a qnode with matplotlib
- Parameters:
qnode (.QNode or Callable) – the input QNode/quantum function that is to be drawn.
wire_order (Sequence[Any]) – the order (from top to bottom) to print the wires of the circuit. If not provided, the wire order defaults to the device wires. If device wires are not available, the circuit wires are sorted if possible.
show_all_wires (bool) – If True, all wires, including empty wires, are printed.
decimals (int | None) – How many decimal points to include when formatting operation parameters. Default
Nonewill omit parameters from operation labels.style (str) – visual style of plot. Valid strings are
{'black_white', 'black_white_dark', 'sketch',
'pennylane', 'pennylane_sketch', 'sketch_dark', 'solarized_light', 'solarized_dark', 'default'}
. If no style is specified, the global style set withuse_style()will be used, and the initial default is ‘black_white’. If you would like to use your environment’s current rcParams, setstyleto “rcParams”. Setting style does not modify matplotlib global plotting settings.
- Keyword Arguments:
max_length (Optional[int]) – When there are more than
max_lengthlayers, additional plots will be produced with at mostmax_lengthindividual layers.fig (None or matplotlib.Figure) – Matplotlib figure to plot onto. If None, then create a new figure
fontsize (float or str) – fontsize for text. Valid strings are
{'xx-small', 'x-small', 'small', 'medium', large', 'x-large', 'xx-large'}. Default is14.wire_options (dict) – matplotlib formatting options for the wire lines. In addition to standard options, options per wire can be specified with
wire_label: optionspairs, also see examples below.label_options (dict) – matplotlib formatting options for the wire labels
show_wire_labels (bool) – Whether or not to show the wire labels.
active_wire_notches (bool) – whether or not to add notches indicating active wires. Defaults to
True.level (str, int, slice) – An indication of what transforms to apply before drawing. Check
get_compile_pipeline()for more information on the allowed values and usage details of this argument.
- Returns:
A function that has the same argument signature as
qnode. When called, the function will draw the QNode as a tuple of (matplotlib.figure.Figure,matplotlib.axes._axes.Axes). Ifmax_lengthis less than the number of layers, a list of tuples containing the figures and axes will be returned instead.
Warning
Unlike
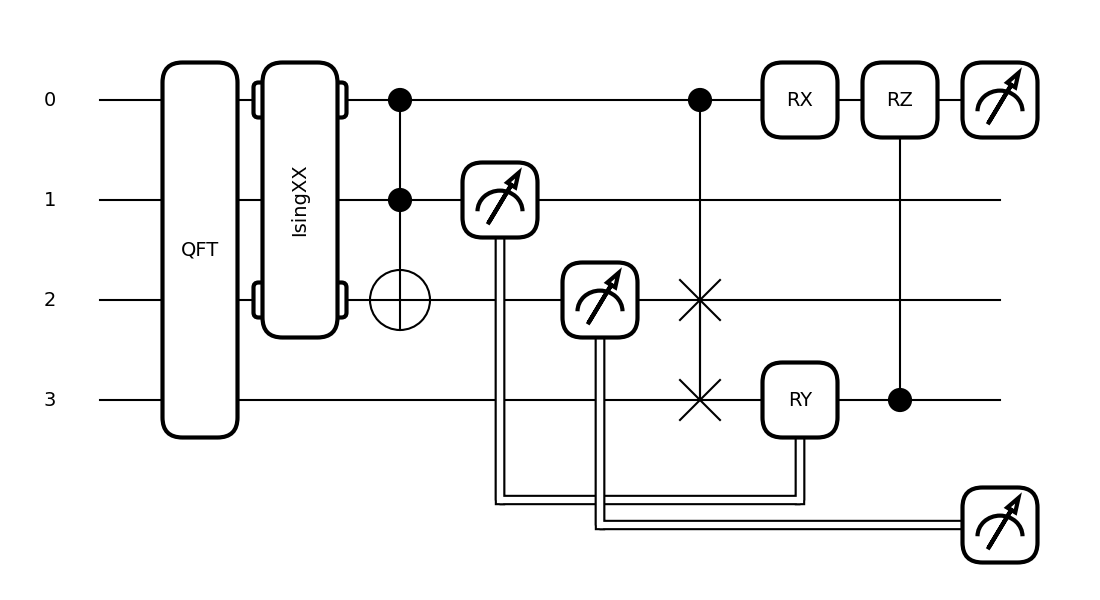
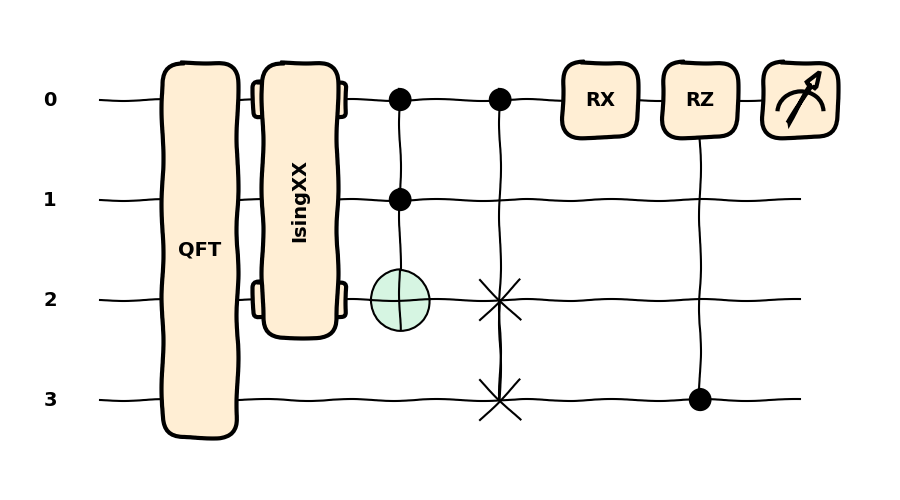
draw(), this function can not draw the full result of a tape-splitting transform. In such cases, only the tape generated first will be plotted.Example:
dev = qp.device('lightning.qubit', wires=(0,1,2,3))

@qp.qnode(dev)
def circuit(x, z):
    qp.QFT(wires=(0,1,2,3))
    qp.IsingXX(1.234, wires=(0,2))
    qp.Toffoli(wires=(0,1,2))
    mcm = qp.measure(1)
    mcm_out = qp.measure(2)
    qp.CSWAP(wires=(0,2,3))
    qp.RX(x, wires=0)
    qp.cond(mcm, qp.RY)(np.pi / 4, wires=3)
    qp.CRZ(z, wires=(3,0))
    return qp.expval(qp.Z(0)), qp.probs(op=mcm_out)


fig, ax = qp.draw_mpl(circuit)(1.2345,1.2345)
fig.show()
Usage Details
Decimals:
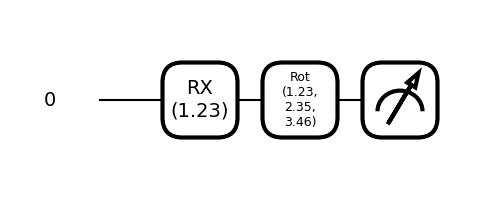
The keyword
decimalscontrols how many decimal points to include when labelling the operations. The default valueNoneomits parameters for brevity.@qp.qnode(dev) def circuit2(x, y): qp.RX(x, wires=0) qp.Rot(*y, wires=0) return qp.expval(qp.Z(0)) fig, ax = qp.draw_mpl(circuit2, decimals=2)(1.23456, [1.2345,2.3456,3.456]) fig.show()
Wires:
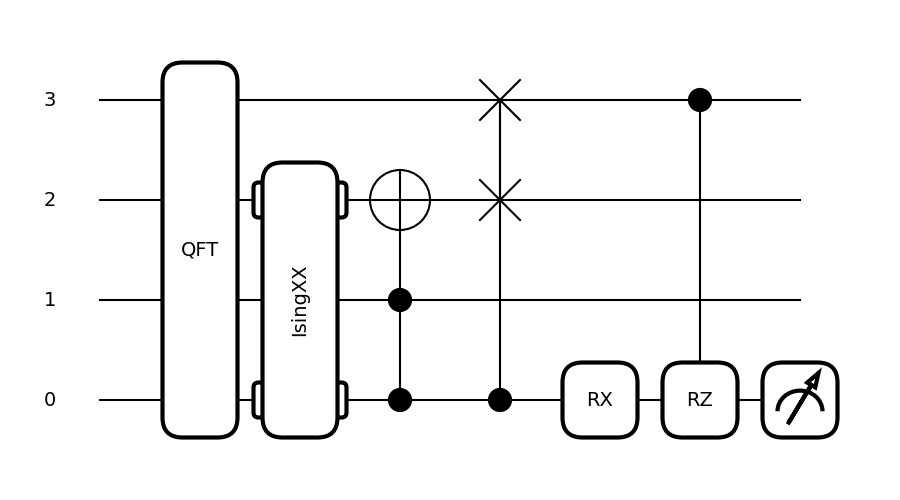
The keywords
wire_orderandshow_all_wirescontrol the location of wires from top to bottom.fig, ax = qp.draw_mpl(circuit, wire_order=[3,2,1,0])(1.2345,1.2345) fig.show()
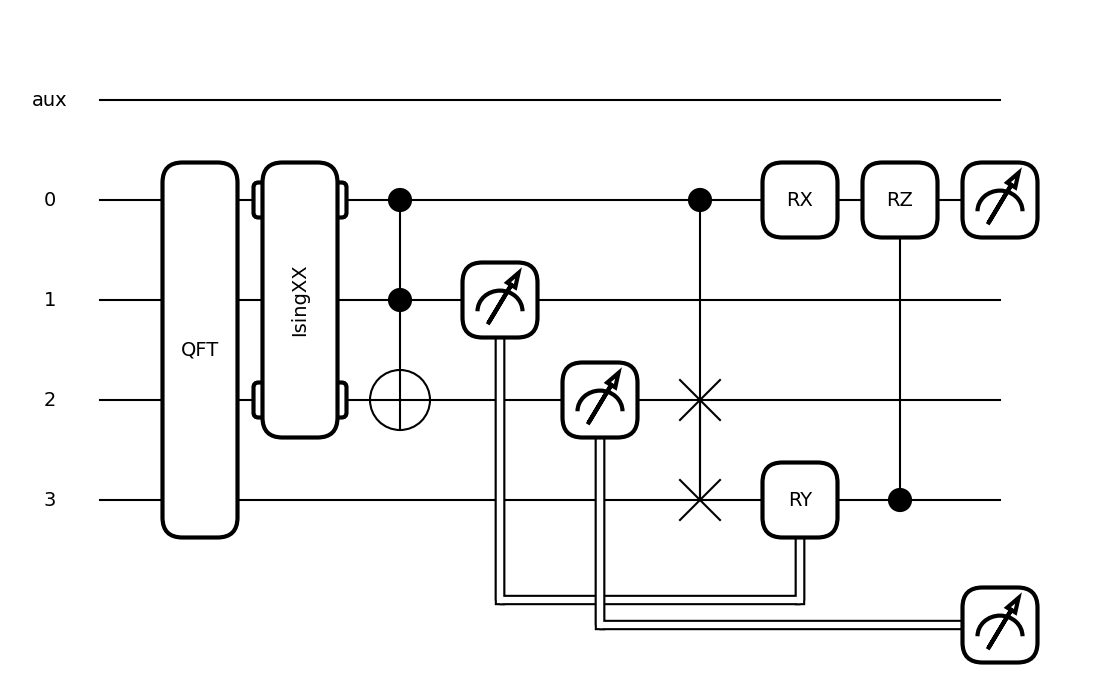
If a wire is in
wire_order, but not in thetape, it will be omitted by default. Only by selectingshow_all_wires=Truewill empty wires be displayed.fig, ax = qp.draw_mpl(circuit, wire_order=["aux"], show_all_wires=True)(1.2345,1.2345) fig.show()
Max Length:
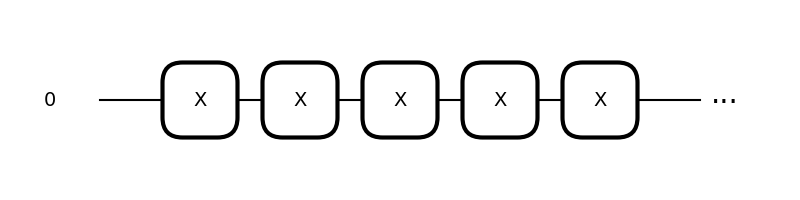
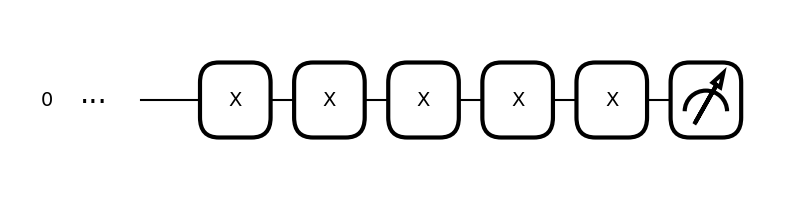
For deep circuits, the
max_lengthkwarg can break the circuit into multiple independent figures.def deep_circuit(): for _ in range(10): qp.X(0) return qp.expval(qp.Z(0)) [(fig1, ax1), (fig2, ax2)] = qp.draw_mpl(deep_circuit, max_length=5)()
Integration with matplotlib:
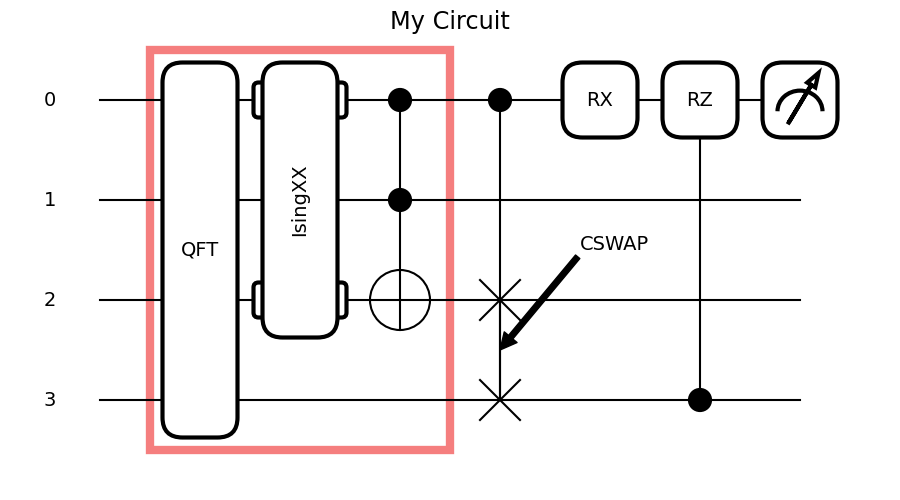
This function returns matplotlib figure and axes objects. Using these objects, users can perform further customization of the graphic.
import matplotlib.pyplot as plt

fig, ax = qp.draw_mpl(circuit)(1.2345,1.2345)
fig.suptitle("My Circuit", fontsize="xx-large")

options = {'facecolor': "white", 'edgecolor': "#f57e7e", "linewidth": 6, "zorder": -1}
box1 = plt.Rectangle((-0.5, -0.5), width=3.0, height=4.0, **options)
ax.add_patch(box1)

ax.annotate("CSWAP", xy=(5, 2.5), xycoords='data', xytext=(5.8,1.5), textcoords='data',
            arrowprops={'facecolor': 'black'}, fontsize=14)

ax.annotate("classical control flow", xy=(3.5, 4.2), xycoords='data', xytext=(0.8,4.2),
            textcoords='data', arrowprops={'facecolor': 'blue'}, fontsize=14,
            va="center")
fig.show()
Formatting:
PennyLane has inbuilt styles for controlling the appearance of the circuit drawings. All available styles can be determined by evaluating
qp.drawer.available_styles(). Any available string can then be passed via the kwargstyleto change the settings for that plot. This will not affect style settings for subsequent matplotlib plots.fig, ax = qp.draw_mpl(circuit, style='sketch')(1.2345,1.2345) fig.show()
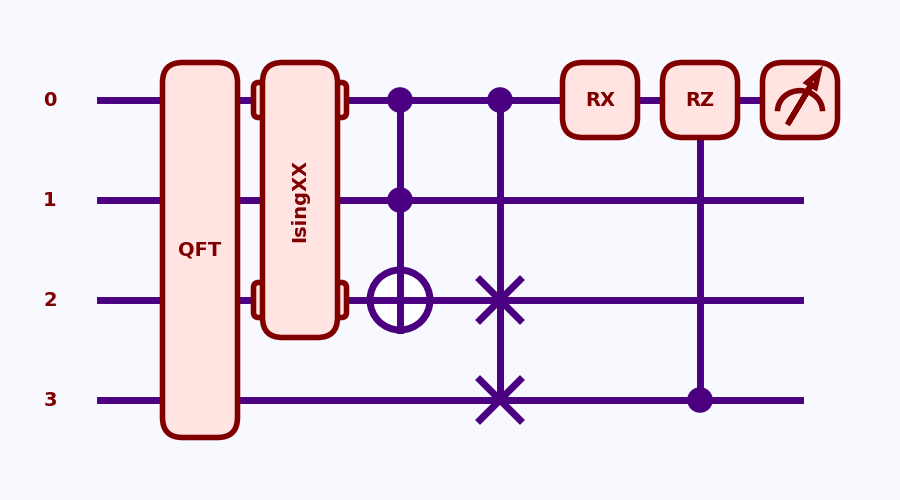
You can also control the appearance with matplotlib’s provided tools, see the matplotlib docs . For example, we can customize
plt.rcParams. To use a customized appearance based on matplotlib’splt.rcParams,qp.draw_mplmust be run withstyle="rcParams":plt.rcParams['patch.facecolor'] = 'mistyrose' plt.rcParams['patch.edgecolor'] = 'maroon' plt.rcParams['text.color'] = 'maroon' plt.rcParams['font.weight'] = 'bold' plt.rcParams['patch.linewidth'] = 4 plt.rcParams['patch.force_edgecolor'] = True plt.rcParams['lines.color'] = 'indigo' plt.rcParams['lines.linewidth'] = 2 plt.rcParams['figure.facecolor'] = 'ghostwhite' fig, ax = qp.draw_mpl(circuit, style="rcParams")(1.2345,1.2345) fig.show()
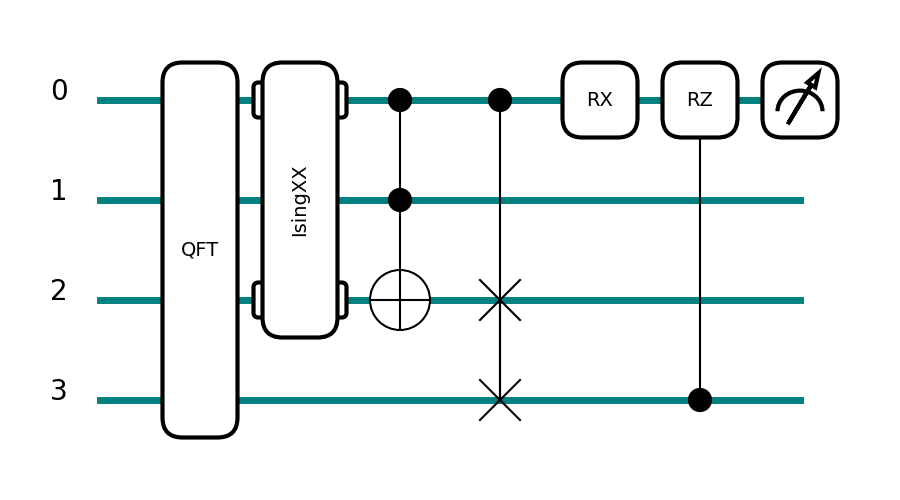
The wires and wire labels can be manually formatted by passing in dictionaries of keyword-value pairs of matplotlib options.
wire_optionsaccepts options for lines, andlabel_optionsaccepts text options.fig, ax = qp.draw_mpl(circuit, wire_options={'color':'teal', 'linewidth': 5}, label_options={'size': 20})(1.2345,1.2345) fig.show()
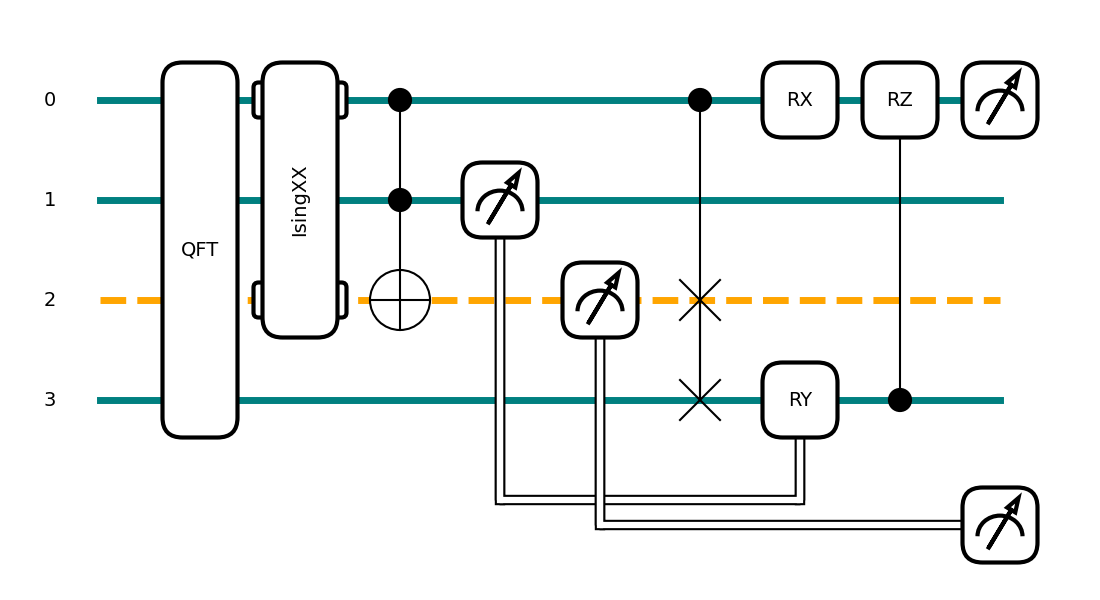
Additionally,
wire_optionsmay contain sub-dictionaries of matplotlib options assigned to separate wire labels, which will control the line style for the respective individual wires.wire_options = { 'color': 'teal', # all wires but wire 2 will be teal 'linewidth': 5, # all wires but wire 2 will be bold 2: {'color': 'orange', 'linestyle': '--'}, # wire 2 will be orange and dashed } fig, ax = qp.draw_mpl(circuit, wire_options=wire_options)(1.2345,1.2345) fig.show()
Levels:
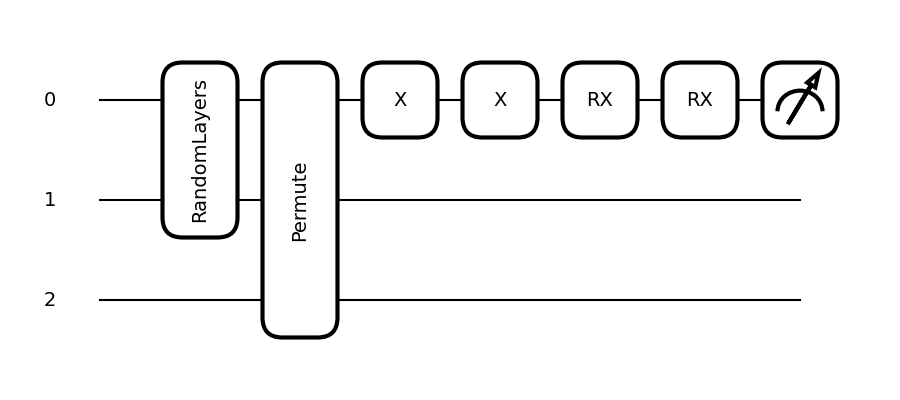
The
levelkeyword argument allows one to select a subset of the transforms to apply on theQNodebefore carrying out any drawing. Take, for example, this circuit:@qp.transforms.merge_rotations @qp.transforms.cancel_inverses @qp.qnode(qp.device("default.qubit"), diff_method="parameter-shift") def circ(): qp.RandomLayers([[1.0, 20]], wires=(0, 1)) qp.Permute([2, 1, 0], wires=(0, 1, 2)) qp.PauliX(0) qp.PauliX(0) qp.RX(0.1, wires=0) qp.RX(-0.1, wires=0) return qp.expval(qp.PauliX(0))
One can plot the circuit without any transforms applied by passing
level="top"orlevel=0:fig, ax = qp.draw_mpl(circ, level="top")() fig.show()
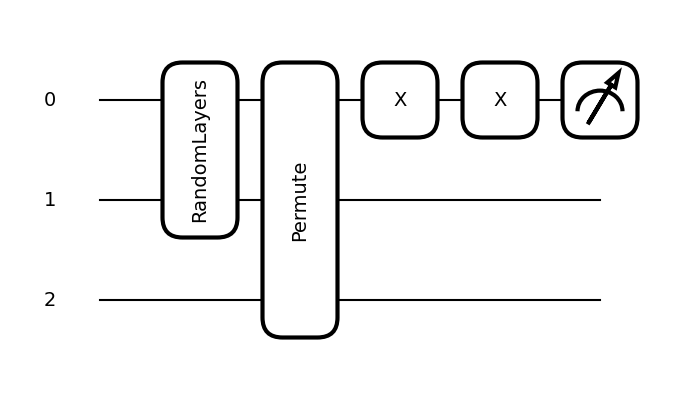
Or plot the circuit after applying the transforms manually applied on the QNode (
merge_rotationsandcancel_inverses):fig, ax = qp.draw_mpl(circ, level="user")() fig.show()
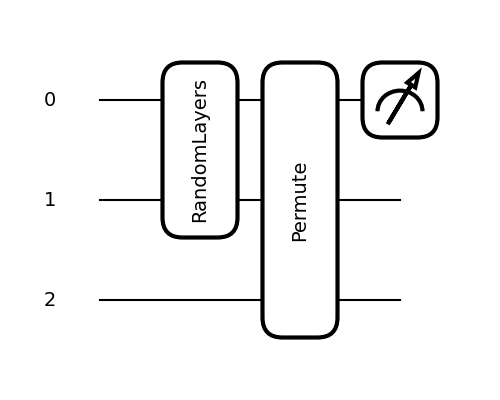
To apply all of the transforms, including those carried out by the differentiation method and the device, use
level="device":fig, ax = qp.draw_mpl(circ, level="device")() fig.show()
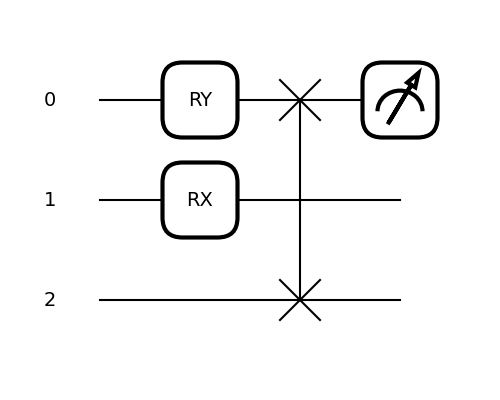
Slices can also be passed to the
levelargument. So one can, for example, request that only themerge_rotationstransform is applied:fig, ax = qp.draw_mpl(circ, level=slice(1, 2))() fig.show()
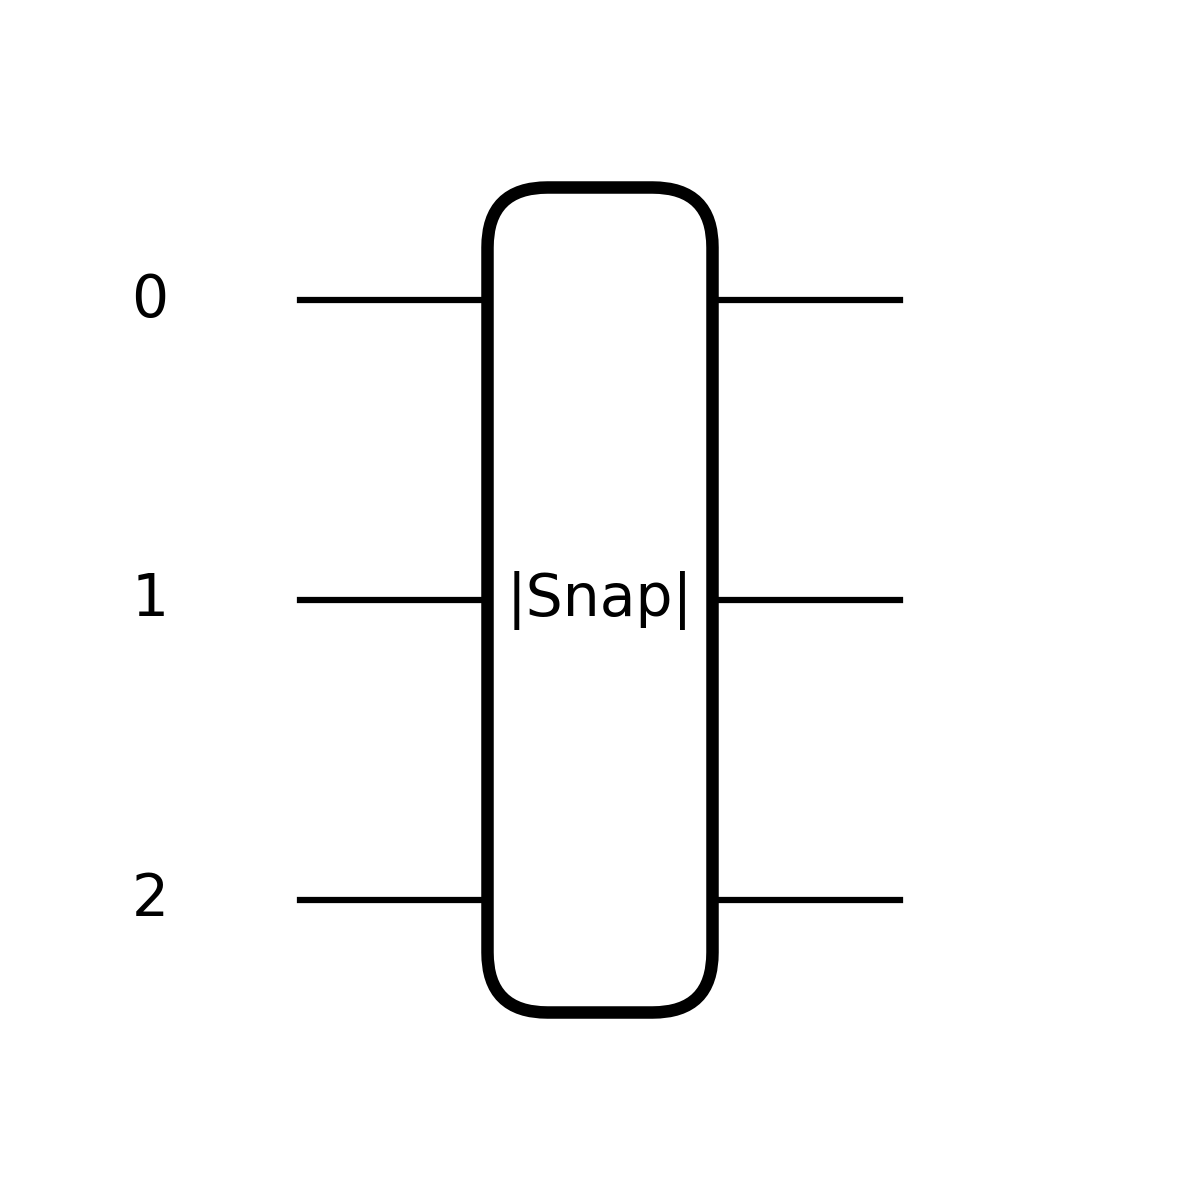
Operators without wires:
Some operators deviate from the standard
Operatorclass in their handling of wires. In particular, tools likeSnapshotalways occupy all qubits, and are drawn accordingly:draw_kwargs = {"wire_order" : [0, 1, 2], "show_all_wires" : True} fig, ax = qp.draw_mpl(qp.Snapshot, **draw_kwargs)() fig.show()
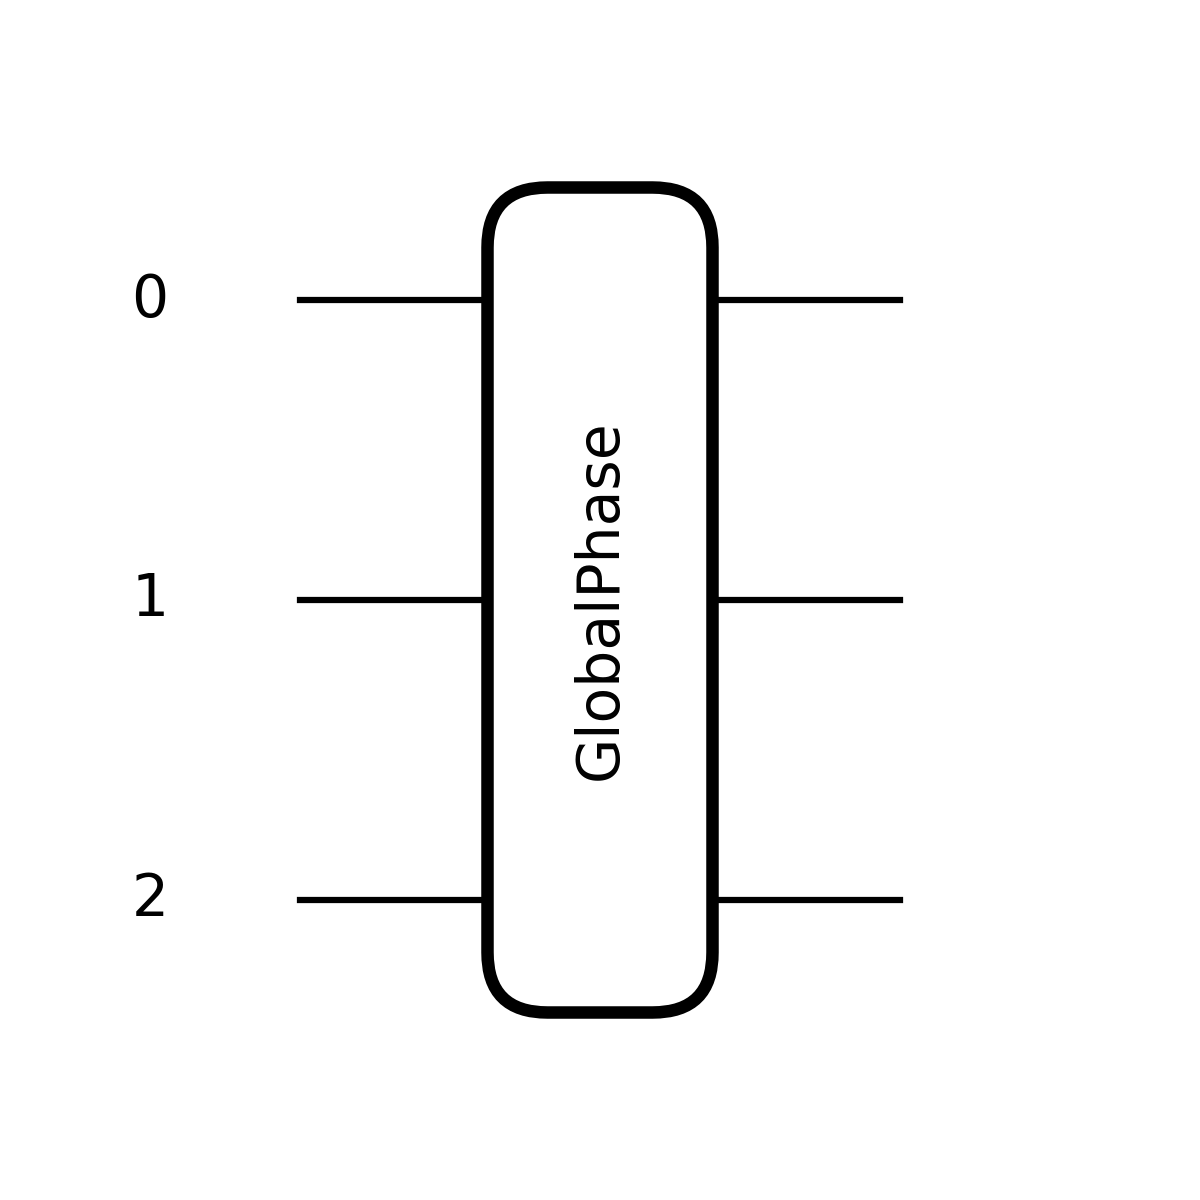
In addition, globally acting operators like
GlobalPhaseorIdentityare always represented on all wires:fig, ax = qp.draw_mpl(qp.GlobalPhase, **draw_kwargs)(phi=0.5, wires=[]) fig.show()

This is the case even if they are provided with a subset of all wires:
fig, ax = qp.draw_mpl(qp.GlobalPhase, **draw_kwargs)(phi=0.5, wires=[0])
fig.show()
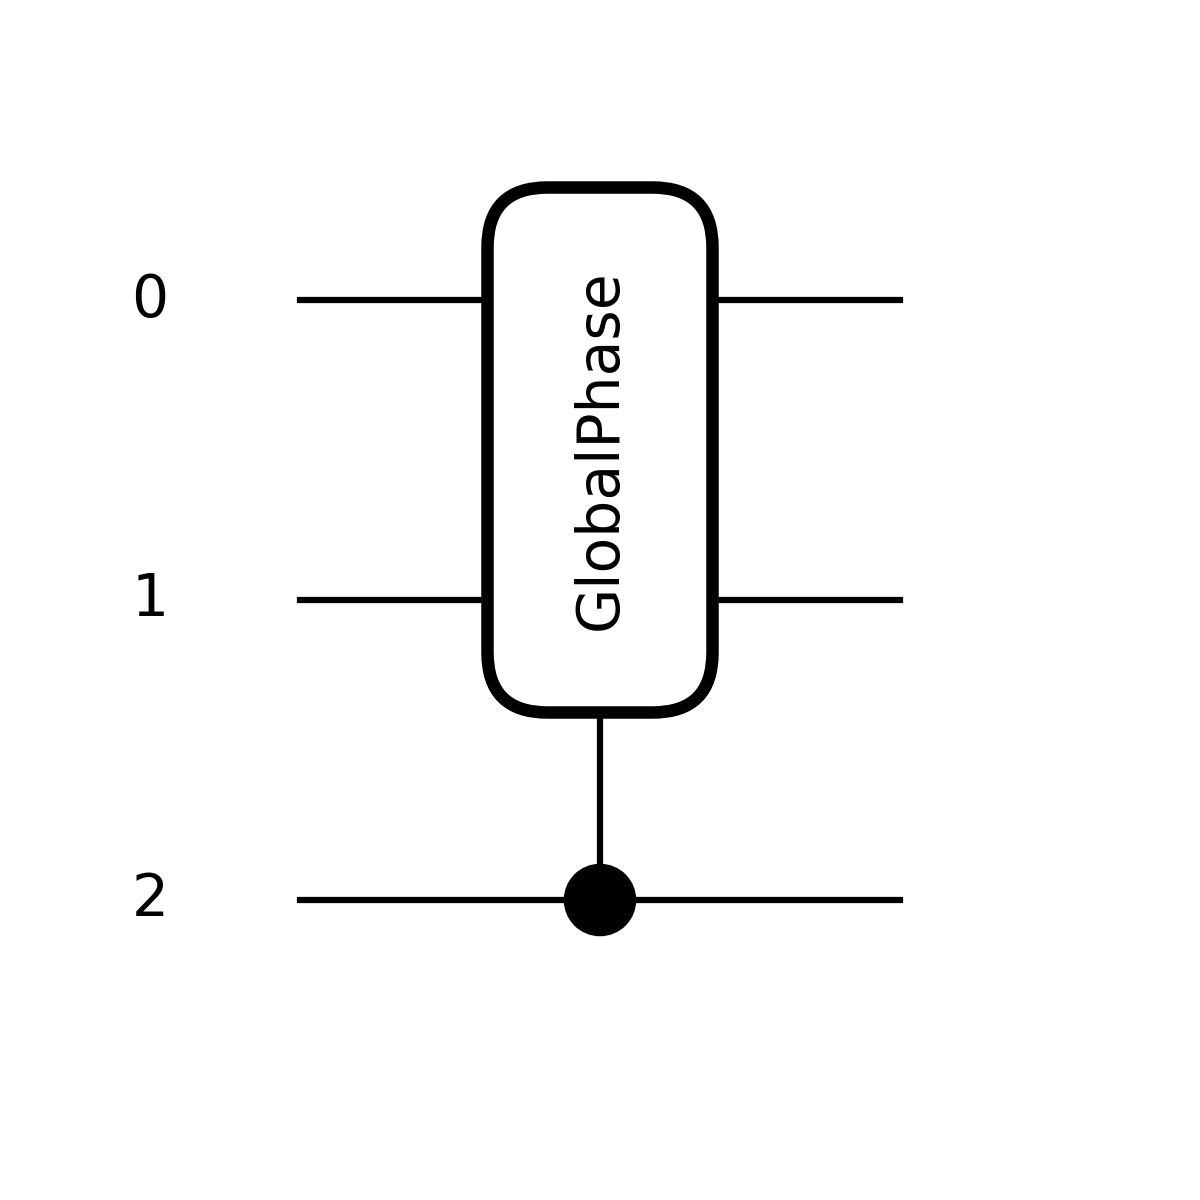
For controlled versions of these globally acting operators, the control nodes are exempt from the expansion:
ctrl_gphase = qp.ctrl(qp.GlobalPhase, control=[2])
fig, ax = qp.draw_mpl(ctrl_gphase, **draw_kwargs)(phi=0.5, wires=[0])
fig.show()